Credminds Small Business AI Demand Index · July 2026 edition
AI receptionist statistics, from six years of search data.
Most AI receptionist statistics pages recycle the same third-party market forecasts. This one publishes something different: what US businesses actually search for, measured monthly since August 2020 across 75 tracked keywords. Updated quarterly, sources and methodology below, every figure citable.
Data through June 2026 · Updated July 21, 2026 · Published by Credminds. Disclosure: we build custom AI receptionists, which is why we publish the demand data neutrally and name no vendors here, including ourselves.
Key statistics, one line each.
Every figure below links to itself, so you can cite the exact stat. Unless a source is named, the data is our first-party analysis of Google Ads search volume estimates for United States searches, trailing-12-month windows.
-
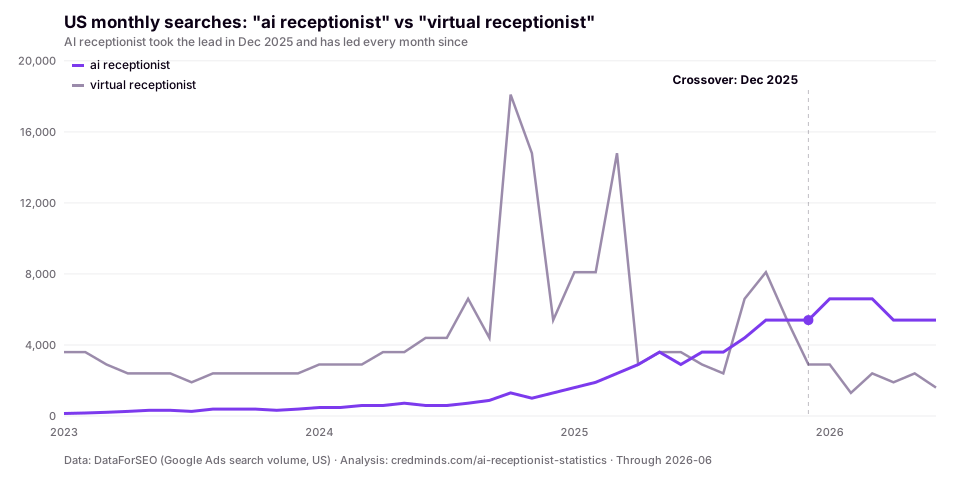
US monthly searches for "ai receptionist" overtook "virtual receptionist" in December 2025 and have led every month since.
7 consecutive months in the lead through June 2026. #
-
Searches for "ai receptionist" roughly tripled year over year: approximately 63,800 US searches in the 12 months through June 2026, up from approximately 21,100 the year before.
Trailing-12-month totals, computed from monthly Google Ads estimates. #
-
Search demand for "ai receptionist" has grown approximately 35x in three years.
From roughly 1,820 searches in the 12 months through June 2023 to roughly 63,800 in the 12 months through June 2026. #
-
Searches for "virtual receptionist" fell approximately 57% year over year, from roughly 94,800 to roughly 40,800 annual searches.
The largest decline of any term in the index. #
-
"ai answering service" grew approximately 83% year over year while "answering service for small business" fell approximately 47%.
The substitution pattern repeats across every pair we track. #
-
"ai receptionist for small business" did not exist in Google's keyword database before September 2024. It now runs at approximately 1,300 searches per month, up 519% year over year on Google's trend metric.
One of five index keywords born since 2024. #
-
Searches for "ai readiness assessment" grew approximately 177% year over year, from roughly 2,990 to roughly 8,270 annual searches.
Businesses are searching for evaluation help before they buy tools. #
-
58% of US small businesses report using generative AI in 2025, up from 40% in 2024 and 23% in 2023, according to the US Chamber of Commerce.
Third-party adoption data; every other stat on this page is our first-party search demand data. #
Search demand: the first-party data.
The chart most of this page hangs on: monthly US searches for "ai receptionist" against "virtual receptionist", the term the industry used for two decades. The lines crossed in December 2025, and the gap has widened every quarter since.
"ai receptionist", average monthly searches by year
| Year | Avg monthly US searches |
|---|---|
| 2022 | ~62 |
| 2023 | ~297 |
| 2024 | ~770 |
| 2025 | ~3,592 |
| 2026 (H1) | ~6,000 |
Growth leaderboard: trailing 12 months vs the year before
Every keyword in the index with enough history for a fair trailing-12-month comparison, ranked by growth. Both directions shown, because an index that hides its decliners is marketing, not data.
| Keyword | Searches, last 12 mo | Change vs prior 12 mo |
|---|---|---|
| "ai agent for business" | ~12,400 | +232% |
| "ai receptionist" | ~63,800 | +203% |
| "ai phone answering service" | ~11,000 | +197% |
| "ai readiness assessment" | ~8,270 | +177% |
| "ai automation agency" | ~48,800 | +170% |
| "ai automation for small business" | ~2,650 | +160% |
| "ai answering service" | ~26,300 | +83% |
| "ai consultant for small business" | ~6,210 | +83% |
| "ai voice agent" | ~27,700 | +80% |
| "ai tools for small business" | ~9,720 | +40% |
| "ai for small business" | ~21,300 | +21% |
| "ai virtual receptionist" | ~2,240 | +9% |
| "ai for law firms" | ~15,300 | +3% |
| "chatbot for small business" | ~2,050 | -13% |
| "answering service for small business" | ~9,720 | -47% |
| "virtual receptionist" | ~40,800 | -57% |
AI vs traditional: the substitution.
The clearest pattern in six years of data is not growth, it is replacement. For every traditional phone-coverage term losing volume, an AI counterpart is gaining it. Searches for "answering service for small business" fell approximately 47% year over year at the same time "ai answering service" grew approximately 83%. Across the whole basket, the median traditional-service term lost roughly half its search volume year over year on Google's trend metric.
| Category | AI term | Monthly searches | Traditional term | Monthly searches |
|---|---|---|---|---|
| Reception | "ai receptionist" (up sharply) | ~5,400 | "virtual receptionist" (roughly halved) | ~3,600 |
| Answering services | "ai answering service" (more than doubled) | ~2,400 | "answering service for small business" (down by about three quarters) | ~880 |
| Small business answering | "ai answering service for small business" (growing) | ~260 | "virtual receptionist for small business" (roughly halved) | ~320 |
Current monthly volumes with the direction of Google's reported yearly trend in parentheses.
Industry demand pairs.
The same substitution, by vertical. AI-side terms in these industries are still small, so we publish volumes with trend direction only; percentages on sub-500 terms would be bucketing noise dressed up as precision.
| Industry | AI term | Monthly searches | Traditional term | Monthly searches |
|---|---|---|---|---|
| Law | "ai for law firms" (up sharply) | ~1,300 | "law firm answering service" (roughly halved) | ~260 |
| Medical | "ai medical receptionist" (up sharply) | ~140 | "medical answering service" (roughly flat) | ~6,600 |
| Real estate | "ai for real estate agents" (up sharply) | ~590 | "real estate answering service" (down by about three quarters) | ~260 |
| HVAC | "hvac ai" (growing) | ~210 | "hvac answering service" (roughly halved) | ~480 |
For the verticals where regulation reshapes the whole evaluation, see our guides to AI receptionists for law firms and AI dental receptionists.
What is not growing.
An honest index reports its decelerations. Of the 75 keywords in the basket, 27 are growing at 20% or more year over year, 11 are roughly flat, and 34 are declining, with the decliners concentrated in traditional-service and chatbot-era terms. And 2026 is cooler than 2025: most core AI terms declined from the first quarter to the second this year, where the same quarters in 2025 showed strong growth. Year-over-year demand remains firmly positive; the curve is flattening at a high level, not falling.
| Keyword | Q2 2026 vs Q1 2026 | Same quarters, 2025 |
|---|---|---|
| "ai receptionist" | -18% | +59% |
| "ai voice agent" | -26% | +31% |
| "ai answering service" | +64% | +29% |
| "ai readiness assessment" | -27% | +49% |
New demand signals.
Keywords that did not exist in Google's database before 2024, which is the clearest signal of where the category is heading. Each future edition tracks what was born since the last one.
-
"ai automation for small business"
first tracked April 2024
-
"ai maturity assessment"
first tracked August 2024
-
"ai receptionist for small business"
first tracked September 2024
-
"ai agents for small business"
first tracked September 2024
-
"ai receptionist software"
first tracked January 2025
Small business AI adoption.
Our data measures interest, not adoption. For adoption, the primary source worth citing is the US Chamber of Commerce's annual Empowering Small Business report, which we verified directly rather than through secondhand roundups:
- 58% of small businesses report using generative AI in 2025, up from 40% in 2024 and 23% in 2023 (US Chamber of Commerce, 2025).
- 82% of small businesses that use AI increased their workforce over the past year (US Chamber of Commerce, 2025).
- 96% of small business owners plan to adopt emerging technologies, including AI (US Chamber of Commerce, 2025).
We keep this section deliberately short. Adoption surveys belong to the organizations that run them; this page's job is the demand data nobody else publishes.
How to cite this page.
Cite any stat with attribution to "Credminds Small Business AI Demand Index, July 2026" and a link to this page. Copy-ready lines:
US searches for "ai receptionist" roughly tripled year over year and grew about 35x in three years (Credminds Small Business AI Demand Index, July 2026). https://www.credminds.com/ai-receptionist-statistics
US monthly searches for "ai receptionist" overtook "virtual receptionist" in December 2025 and have led every month since (Credminds Small Business AI Demand Index, July 2026). https://www.credminds.com/ai-receptionist-statistics
Embed the crossover chart
The chart is a static SVG with the source and attribution printed on it. Embed it freely with the link intact:
<a href="https://www.credminds.com/ai-receptionist-statistics">
  <img src="https://www.credminds.com/charts/ai-receptionist-vs-virtual-receptionist.svg"
       alt="US monthly searches for ai receptionist overtook virtual receptionist in December 2025"
       width="960" height="480" loading="lazy" />
</a>Methodology.
Source. Monthly search volume estimates for United States searches from Google Ads data, retrieved via a commercial keyword data API (July 2026), including a historical keyword database with monthly series back to August 2020.
Basket. A frozen basket of 75 keywords across four clusters: phone and reception, agents and automation, voice and readiness, and industry verticals. Inclusion rule: tracked by Google, at least 12 months of data, and at least 100 searches per month. 40 tracked keywords sit below the volume floor on an unpublished watchlist and join the index when they clear it. The basket is frozen per edition and never restated silently.
Two metrics, clearly separated. Hero statistics and the leaderboard use trailing-12-month totals computed from the monthly series, compared against the prior 12-month window. Basket-level distribution and small-volume terms use Google's own reported yearly trend metric, and are labeled approximate. We never publish single-month year-over-year changes for terms under roughly 500 searches per month.
Limitations. Google Ads volumes are bucketed estimates, not exact counts, which is why every figure on this page says "approximately" and uses 12-month windows to smooth bucket jumps. Search demand measures interest, not adoption or revenue. Google restates historical estimates occasionally; each edition's raw snapshot is archived unchanged so published figures stay traceable to their retrieval date.
Exclusions. 10 tracked keywords are excluded from every published figure, each for a stated reason:
- "ai agency": generic term with heavy non-US and non-service ambiguity.
- "voice ai": ambiguous head term (music and voice-cloning intent mixes in).
- "ai for accountants": Google clusters it with an unrelated term.
- "ai email assistant": general productivity intent, outside the small business service scope.
- "conversational ai for business": unstable trend (whipsaw between extreme values), bucket artifact.
- "ai assistant for small business": year-over-year figure driven by a single late-2025 spike and collapse.
- "ai answering machine": consumer hardware intent, not business demand.
- "ai email automation": general productivity intent, outside the small business service scope.
- "hire ai agent": Google clusters it with recruiting-intent queries.
- "ai for contractors": Google clusters it with an unrelated term, single-bucket trend jump.
Cadence. Quarterly. Refreshes update this page in place at this URL: figures are replaced, section anchors are never renamed, and a changelog entry is added below. Changelog: July 2026, first edition.
Reading this because you are choosing an AI receptionist?
The demand data explains why your options multiplied. For the decision itself, start with our plain-language guide to what an AI receptionist is and when it fits, then the honest category-by-category comparison. And if your calls need live data lookups or real booking rules, that is custom-build territory, which is what we do.
Frequently asked.
How fast is search demand for AI receptionists growing?
US searches for "ai receptionist" roughly tripled year over year, from approximately 21,100 searches in the 12 months through June 2025 to approximately 63,800 in the 12 months through June 2026. Over three years, demand grew approximately 35x. Figures are trailing-12-month totals computed from monthly Google Ads search volume estimates.
Have AI receptionists overtaken virtual receptionists?
In search demand, yes. US monthly searches for "ai receptionist" first exceeded "virtual receptionist" in December 2025 and have stayed ahead every month since, while "virtual receptionist" searches fell approximately 57% year over year. This measures what businesses search for, not market revenue.
What percentage of small businesses use AI?
58% of US small businesses reported using generative AI in 2025, up from 40% in 2024 and 23% in 2023, according to the US Chamber of Commerce Empowering Small Business report. The Chamber also found that 82% of small businesses using AI grew their workforce over the past year.
Where does this data come from?
Search volume data comes from Google Ads monthly estimates for United States searches, retrieved via a commercial keyword data API in July 2026. The index tracks a frozen basket of 75 keywords with about 71,600 combined monthly searches, with history back to August 2020. All growth figures use trailing-12-month windows to smooth Google's volume bucketing. The full methodology, including every excluded keyword and the reason, is on this page.